Using Python, OpenCV and AWS Lambda to gather crime statistics – Part 2
This is part two in my quest to determine the long-term crime statistics, in the city where I intend to buy a house. Click here for part one, where I collect the images weekly from the police’s site. In this step, I’ll pick the images out of the S3 bucket, and attempt to find all the pins
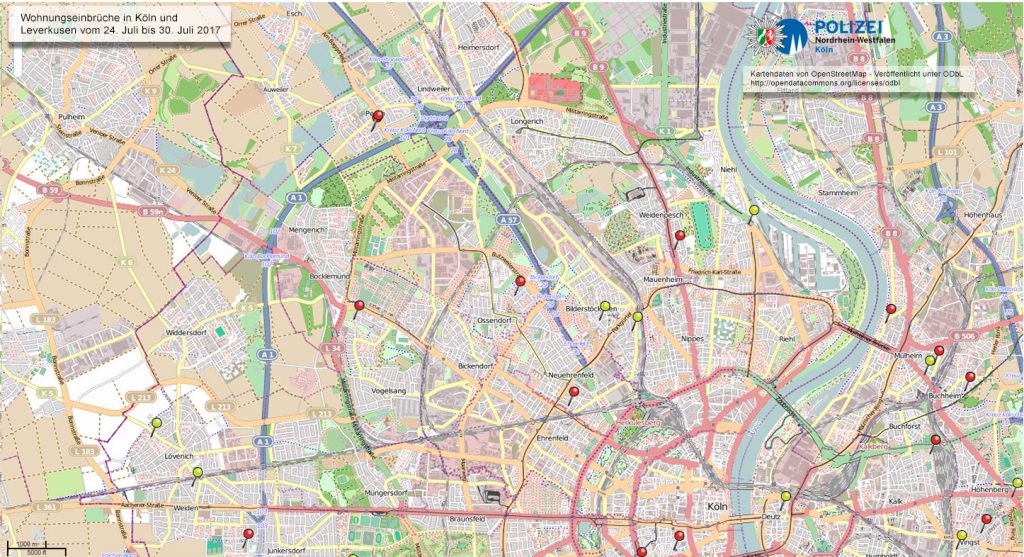
The pins are relatively easy to find, thanks to OpenCV + python-cv. I separated out a red pin and yellow pin and have saved these as the sample of what to look for. The code below will take an image, find all instances of the red and yellow pins in this image.
#!/usr/local/bin/python3
import cv2
import numpy as np

class KeyPoint:
    filename = ''
    px_lat = 0
    px_lon = 0
    dg_lat = 0.0
    dg_lon = 0.0
    found = False

mapimg = KeyPoint()

mapimg.filename = "1502053315-einbruchradar-koeln02_2.jpg"
mapimg.dg_lat = 0.0
mapimg.dg_lon = 0.0

img_rgb = cv2.imread(mapimg.filename)

yellowdot = cv2.imread('yellow_dot.png')
reddot = cv2.imread('red_dot.png')
# Both dots are the same size, so we'll just use yellow as our size ref
d, w, h = yellowdot.shape[::-1]

# matchTemplate searches img_rgb for yellowdot
yres = cv2.matchTemplate(img_rgb,yellowdot,cv2.TM_CCOEFF_NORMED)
rres = cv2.matchTemplate(img_rgb,reddot,cv2.TM_CCOEFF_NORMED)

# only consider tiles which are a 75% or better match
threshold = 0.75
locy = np.where(yres >= threshold)
locr = np.where(rres >= threshold)

# For each found tile, let's draw a rectangle arund it
for pt in zip(*locy[::-1]):
    cv2.rectangle(img_rgb, pt, (pt[0] + w, pt[1] + h), (0,255,255), 2)
    # The offset between pin dot and the point which it is actually stuck is
    # 26 pixels down (+) and 2 pixels to the left (-)
    cv2.rectangle(img_rgb, (pt[0] - 2 , pt[1] + 26), (pt[0] -1 , pt[1] + 25), (255,0,0), 2)
    print("Placing yellow point at %d,%d" % (pt[0],pt[1]))

for pt in zip(*locr[::-1]):
    cv2.rectangle(img_rgb, pt, (pt[0] + w, pt[1] + h), (0,0,255), 2)
    cv2.rectangle(img_rgb, (pt[0] - 2 , pt[1] + 26), (pt[0] -1 , pt[1] + 25), (255,0,0), 2)
    print("Placing red point at %d,%d" % (pt[0],pt[1]))

cv2.imwrite('test_result.png',img_rgb)
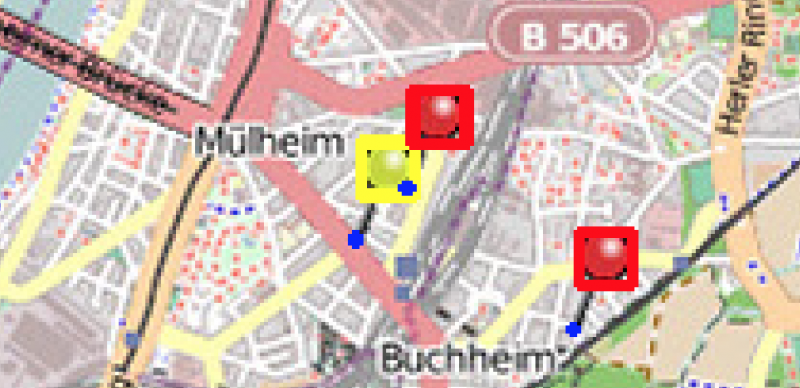
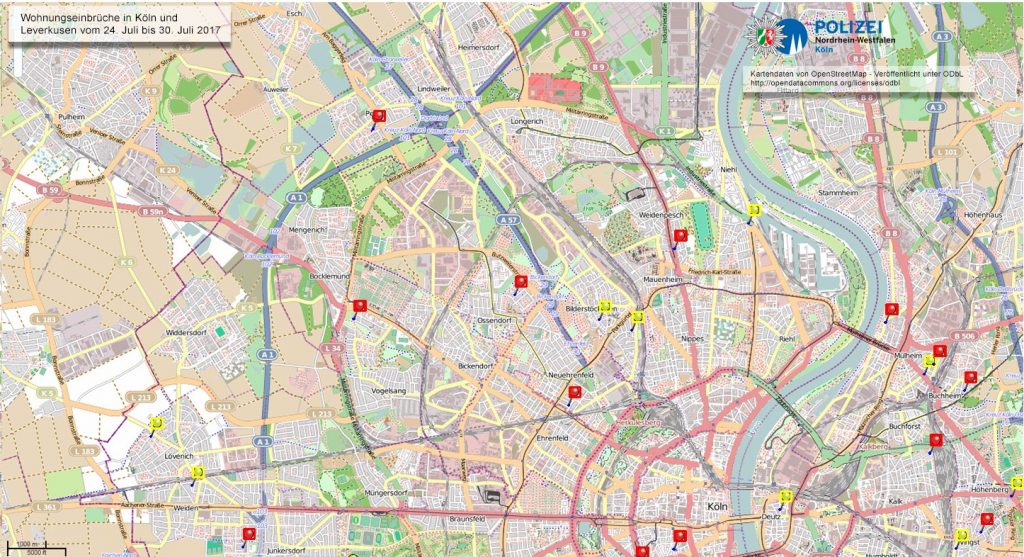
This first attempt seems to work, and draws a red box around all red pins, a yellow box around all yellow pins, and a small blue dot at the base of every pin where it is actually centered:
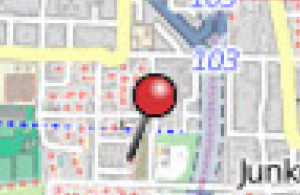
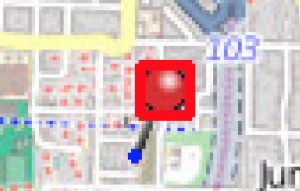
There are however a few issues which require some fine-tuning. One pin is correctly identified as red:
however in the log, it is actually identified as yellow first, then re-found as red afterwards:
Placing yellow point at 344,746
Placing red point at 344,746
There is also a double break-in at the same location (probably two apartments in the same block):
The first issue can be tuned by changing the threshold. I tried also changing the algorithms, but there was no difference dependinging on which algorith was used — they all had the exact same result. Moving the threshold up to 76% helped, as well as re-creating the pin from scratch (rather than from a screenshot. I’m now getting acceptable recognition, still a few duplicates or false positives, but those can be removed based on location (if two are within a pixel). Also, my goal is to get rough statistics, so this is now ‘good enough’, at least until I can try Tensorflow.
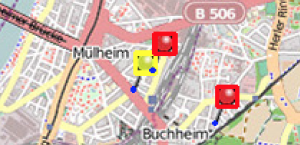
Here is the result after some tuning:
In part 3 I will try to apply geo coordinates to the identified pins, and in part 4 I will load the data into Kibana
